
Background & Problem
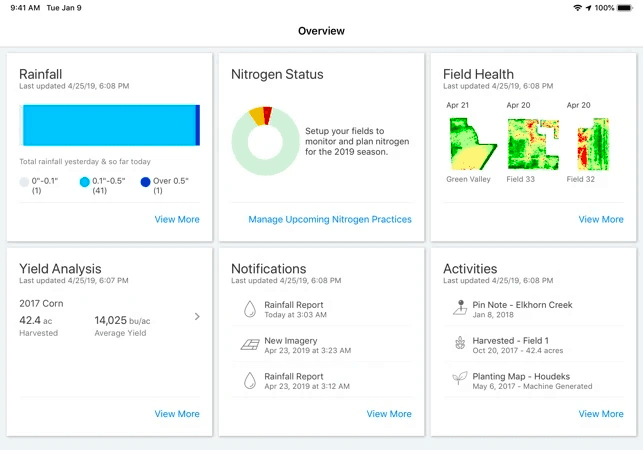
I spent a summer working on Climate FieldView, an app created to help farmers manage their operations, manage risk, and analyze their yield.
A completely different field (pardon the pun) than I’d ever been in before, I was tasked with re-designing the weather portion of the mobile app.
Weather, while one of the most important factors for a farmer’s success, was hidden and difficult to find and use within the app. It took four levels to see forecasted and current conditions, and the only updates immediately was a simple count of rainfall.
Research
At the end of two weeks, four key insights emerged:
Our technology is just one tool in a vast toolkit, one that can lose out against generations of passed down knowledge and gut feel. Climate needs to enhance the farmer’s intuition, not tell them how to run their farm.
Due to the extreme implications of weather on an operation, trust between the farmer and our weather information is more crucial but harder to gain. Good weather = money.
The weather is paradoxically anxiety producing and calming at the same time, driven by curiosity. Understanding weather events to some degree is better than having no idea at all.
Weather is sought out online, but confirmed offline. “Weather talk” is done at the gas station, coffee house, seed shed – it’s social.
Ideating
Understanding these four insights, I sketched, tested, and sketched some more.
By stress-testing these rough concepts with our internal folk as well as customers, I quickly understood that concepts that demonstrated the range of weather data we had resonated way more than something that attempted a recommendation, even if the farmer inputted their own information.
Testing
With some confidence and internal alignment built, I began to wireframe and test at a higher-fidelity level. We scouted out farmers with years of Climate FieldView loyalty, as well as newer customers to elicit a wide range of feedback.
Farmers clicked through these grayscale wireframes before much prompting was provided. The goal was to both concept and usability test a highly visual representation of their fields and weather as opposed to the list views previously used.
Final Designs
The final solution was a map-based approach to demonstrating how weather affects the operation in the past, present and future. Climate’s design team had relied heavily on list views, incorrectly assuming that farmers would have an idea of what to look for when they opened their weather apps.
Instead, the map view allowed farmers to understand what regions would be most important for them in relation to others, not just individual fields without any context of others.


Map View of Across an Operation
This map-based view is the core of the new weather design. when interviewing farmers and dealers, every single one described their operations like this:
“From the North West corner to the South West corner, there are probably 12 fields over a 30 mile stretch. From East to West, there are around 20 across 25 miles.”
I realized just how geo-spatial an operation was. Distance is not only distance between field and field, it’s between field and home, field and seed dealer, field and kid’s school. Wetness of a field is not restricted to that field alone, it’s about how wet that field is compared to another.
In order to align with their mental models of what an operation is, I leveraged a map view so multiple layers of information could be absorbed at once – distance and wetness of a field, as well as time (past and future). In this way, the design fit much better with the daily routine of planning one’s day.
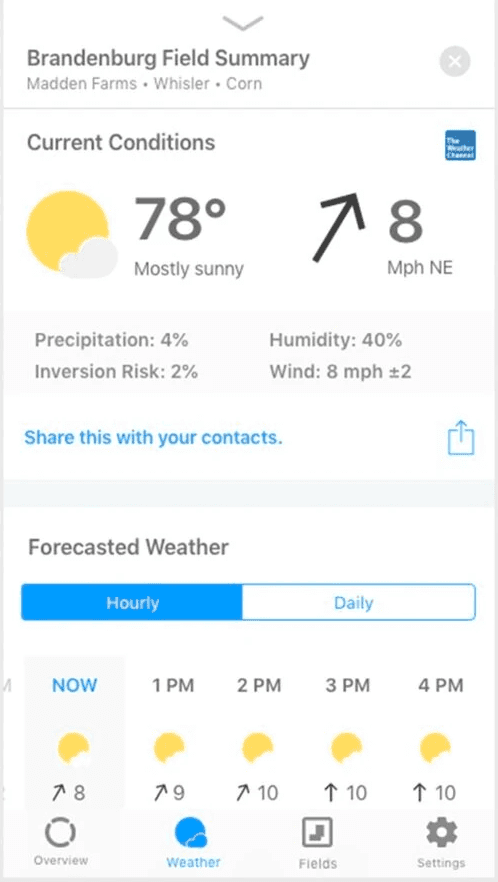
Quick and Deep Dives for a Single Field
Building on the operation as a whole, I designed the ability to see individual field-level weather in a snap, but also go deeper if there was a need. Farmers are often multi-tasking, sticky or sweaty from the fields, so the last thing they need is to have to tap a thousand times to see the information they want.
Here, they can select a single field from the map view, understand the highest priority conditions, then exit. If they have time and want to know more about how that field, they can drag up and see more.
Impact
After wrapping my internship at the beginning of September 2019, I saw three UX changes were made based on my insights and recommendations within the following year.
Reflection
While an internship, I learned a ton about the end-to-end design process and think of this project as one that really showed what design and research could produce. Things I think about now:
No constraints means less actual customer impact. I was working solo here, and had almost no constraints. While freeing and fun, it meant that less of the actual design work could be implemented into the product since those conversations weren't had throughout the process.
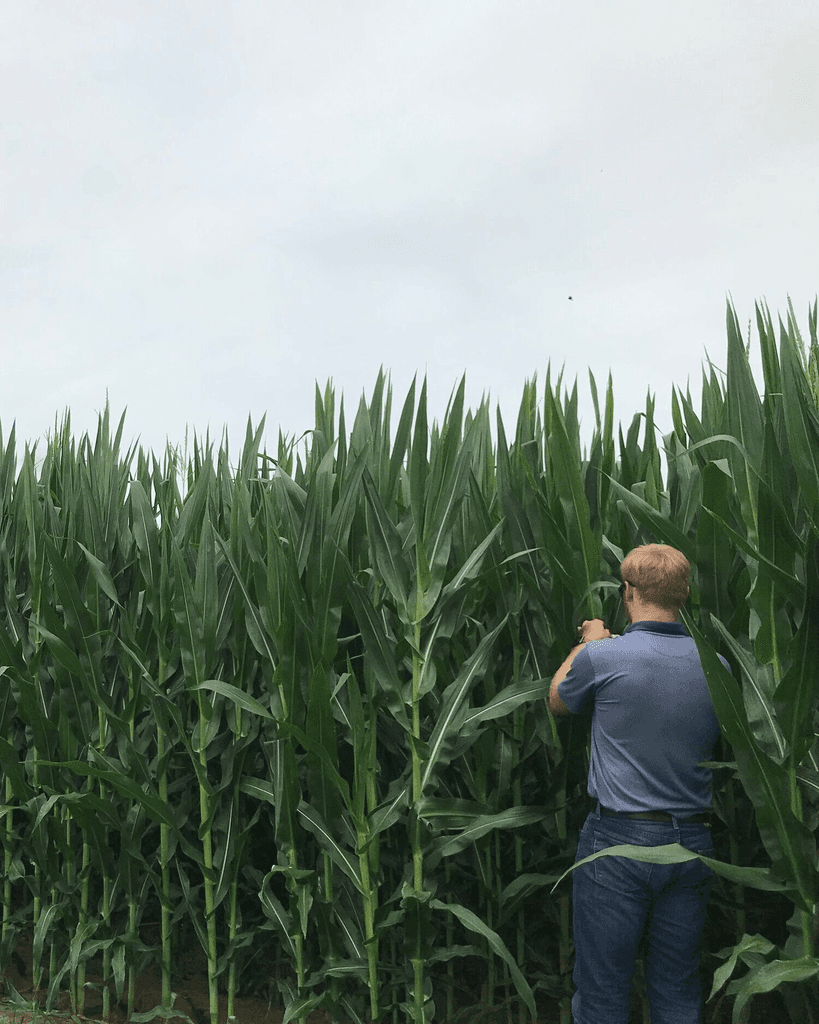
There's nothing like seeing for yourself. This was the first opportunity I'd have to do research in person, and it really changed how I think about research. Being in an environment, meeting face-to-face, it all adds up to better insight, deeper empathy, and stronger design work.